A search for jaguar returns pages about the animal, the car, and a version of the Mac operating system, interleaved in one ranked list. If the results were grouped by subject, the searcher could go straight to the group they meant. Grouping documents by similarity, with no list of categories given in advance, is clustering. This article defines the problem, describes what clustering is used for in retrieval, and tests the assumption that makes those uses work: that similar documents tend to be relevant to the same information needs.
Clustering as unsupervised learning
A clustering algorithm takes a set of documents and a measure of similarity and partitions the documents into groups, or clusters. Documents within a cluster should be similar to each other, and documents in different clusters dissimilar (Manning, Raghavan, and Schütze, 2008, chapter 16). No labels are given. The algorithm discovers the structure, and its output is only as meaningful as the similarity measure and representation behind it. That is the essential difference from classification. A classifier learns categories that people defined and labeled. A clustering finds groups that people must then interpret, and the groups need not correspond to any categories a person would have chosen.
Clusterings differ along two dimensions:
- Hard or soft. A hard clustering assigns each document to exactly one cluster. A soft clustering gives each document a degree of membership in every cluster, which suits documents that cover several subjects. The topic models of a later topic are soft clusterings of words and documents.
- Flat or hierarchical. A flat clustering produces one set of clusters with no relation among them, as K-means does. A hierarchical clustering produces a tree, from small, tight clusters at the bottom to large, general ones at the top.
What clustering is for
Manning, Raghavan, and Schütze (2008, §16.1) list several uses in retrieval:
- Search result clustering. Group the top results for a query by subject, so that an ambiguous query's different senses become visible. Scatter/Gather applied this idea to retrieval results (Hearst and Pedersen, 1996), and some search engines have presented clustered results.
- Collection browsing. Organize a collection into clusters, or a hierarchy of them, that people can explore without knowing what to search for. The original Scatter/Gather system clustered whole collections and reclustered the groups a user selected (Cutting, Karger, Pedersen, and Tukey, 1992).
- Language modeling and smoothing. Estimate a document's term statistics partly from the documents in its cluster, which helps for short documents with few words of their own.
- Cluster-based retrieval. Compare the query with cluster centroids rather than every document, and retrieve whole clusters. This can save work, and, if similar documents share relevance, it can find relevant documents that share little vocabulary with the query.
Clustering is also widely used outside retrieval, for example to find groups of similar customers, as the Goodreads reviewer clustering does, and to detect near-duplicate documents.
The cluster hypothesis
All of these uses depend on one assumption, stated by van Rijsbergen (1979) as the cluster hypothesis:
Closely associated documents tend to be relevant to the same requests.
If it holds, a document's neighbors are a good guide to whether it is relevant, and grouping documents by similarity groups them by relevance. If it fails, clustering organizes documents in a way that has nothing to do with what searchers want.
The hypothesis can be tested with relevance judgments. Voorhees (1985) proposed a nearest-neighbor test: for each relevant document, look at its few most similar documents in the collection and count how many are also relevant to the same query. If the hypothesis holds, the count should be far higher than chance would give.
A test on Cranfield
The test was run on the Cranfield collection of 1,400 aerodynamics abstracts, using the 225 queries and their relevance judgments, with documents represented as length-normalized TF-IDF vectors (logarithmic term frequency) after the text processing described in comparing ranking models. For each of the 1,606 relevance judgments (query and relevant document pairs) belonging to queries with at least two relevant documents, the five most similar other documents in the collection were found by cosine similarity:
| Measure | Value |
|---|---|
| Relevant documents among the five nearest neighbors, on average | 1.33 |
| The same, expected by chance | 0.037 |
| Relevant documents with at least one relevant neighbor among the five | 68.5% |
| Mean cosine between two documents relevant to the same query | 0.153 |
| Mean cosine between a relevant and a nonrelevant document | 0.044 |
A relevant document's nearest neighbors are about 36 times as likely to be relevant to the same query as a randomly chosen document is. Documents relevant to the same query are, on average, about three and a half times as similar to each other as they are to the rest of the collection. On Cranfield, the cluster hypothesis holds strongly.
Where the chance figure comes from
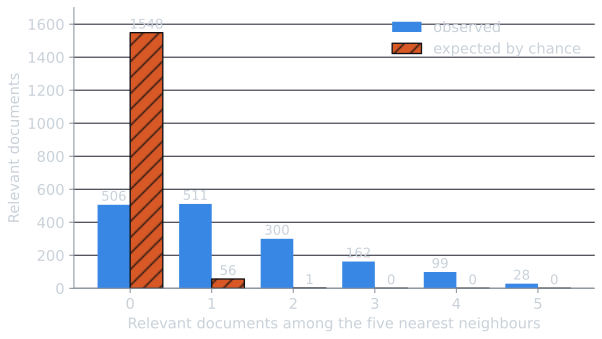
Take a query with $R$ relevant documents and one of them, $d$. Its five nearest neighbors are five of the other $1{,}399$ documents, and $R - 1$ of those are relevant. If similarity carried no information about relevance, the five would be a random sample, and the expected number of relevant ones would be $5(R - 1)/1{,}399$. For a query with 8 relevant documents that is $5 \times 7 / 1{,}399 = 0.025$. Averaging this over all 1,606 tested documents gives the 0.037 in the table. The full distribution under chance is hypergeometric (drawing five documents without replacement from $1{,}399$ of which $R - 1$ are relevant), and the observed counts are nothing like it:
One query traced
Query 82 of the collection asks how the methods of Küchemann and Multhopp for calculating lift distributions on swept wings in subsonic flow compare with each other and with experiment. It has five relevant documents, and it was chosen as the query with the median neighbor count among queries with four to six relevant documents, so it is typical rather than flattering. Each row lists the five nearest neighbors of one relevant document, by document number, with the cosine similarity; a neighbor in bold is itself relevant to query 82:
| Relevant document | Its five nearest neighbors (cosine) |
|---|---|
| 205: airfoil section data correlated with loads measured on a 45° sweptback wing | 1290 (0.239), 679 (0.235), 793 (0.229), 204 (0.225), 674 (0.201) |
| 676: a simple method for calculating span and chordwise loading on straight and swept wings | 783 (0.257), 247 (0.249), 203 (0.247), 287 (0.209), 674 (0.207) |
| 677: methods for calculating the lift distribution of wings | 1280 (0.246), 1342 (0.176), 637 (0.167), 204 (0.165), 704 (0.153) |
| 678: the effect of end plates on swept wings | 247 (0.215), 1343 (0.192), 676 (0.187), 794 (0.185), 287 (0.181) |
| 679: low speed tests on 45° sweptback wings | 674 (0.254), 205 (0.235), 513 (0.214), 675 (0.195), 676 (0.184) |
Four of the 25 neighbor slots hold a relevant document, an average of 0.8 per document against a chance expectation of $5 \times 4 / 1{,}399 = 0.014$. Several of the other neighbors, such as 674 and 204, appear in more than one row: they are documents about swept wings (674 on their drag, 204 on estimating their characteristics from airfoil section data) that the judges did not mark relevant to this particular comparison of two methods. The relevant documents sit in a neighborhood of related work, not in a tight group of their own.
How large a neighborhood
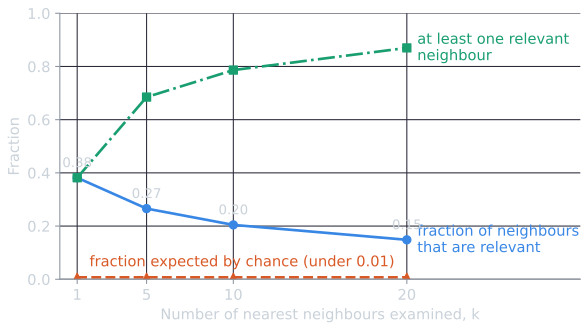
The choice of five neighbors is arbitrary. Repeating the test with other numbers $k$ of neighbors:
| $k$ | Relevant among the $k$ nearest | Fraction relevant | Expected by chance | Ratio | At least one relevant |
|---|---|---|---|---|---|
| 1 | 0.382 | 0.382 | 0.007 | 52 | 38.2% |
| 5 | 1.328 | 0.266 | 0.037 | 36 | 68.5% |
| 10 | 2.044 | 0.204 | 0.073 | 28 | 78.6% |
| 20 | 2.965 | 0.148 | 0.146 | 20 | 87.0% |
The single nearest neighbor of a relevant document is itself relevant 38 percent of the time, 52 times the chance rate. Wider neighborhoods catch more relevant documents but dilute them: the fraction relevant falls from 0.38 to 0.15 as $k$ grows from 1 to 20, while staying 20 or more times above chance.
Van Rijsbergen's test
Van Rijsbergen (1979, chapter 3) described an earlier and simpler test of the hypothesis. For each query, compute the similarity of every pair of documents that are both relevant (R-R pairs) and of every pair with one relevant and one nonrelevant document (R-N pairs), pool the values over all queries, and compare the two distributions. If the hypothesis holds, the R-R distribution should lie well to the right of the R-N one; the less the two overlap, the more a clustering can separate relevant documents from the rest.
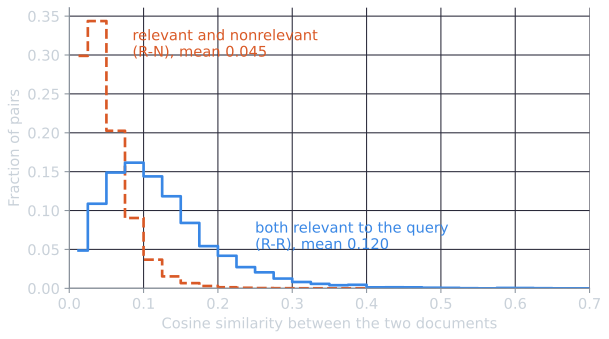
Pooled this way, R-R pairs have mean similarity 0.120 and median 0.105, against 0.045 and 0.039 for R-N pairs. The separation is clearest in the tail: 13.2 percent of R-R pairs have similarity above 0.2, against 0.3 percent of R-N pairs. (The means in the table above, 0.153 and 0.044, average each query's mean, so every query counts equally; pooling counts every pair equally and gives more weight to queries with many relevant documents, whose relevant documents are less alike.) The overlap is large, which is the same caution as the third of relevant documents with no relevant neighbor: similarity is evidence of shared relevance, not proof.
Do relevant documents land in the same cluster?
The tests so far look at neighborhoods. Retrieval systems that use clusters see something coarser: whether two documents fall in the same cluster. Clustering Cranfield with K-means (the same vectors, k-means++ seeding, 30 seeds for each $K$) and counting how often a pair of documents relevant to the same query ends up in one cluster, compared with a pair of documents chosen at random:
| Clusters $K$ | Co-relevant pairs in the same cluster | Random pairs in the same cluster | Ratio |
|---|---|---|---|
| 10 | 44.8% (42.5 to 48.3) | 12.6% (11.6 to 13.3) | 3.6 |
| 25 | 33.2% (31.3 to 34.8) | 5.6% (5.3 to 6.4) | 5.8 |
| 50 | 23.0% (22.0 to 24.3) | 3.0% (2.8 to 3.2) | 7.7 |
Values are medians over the 30 runs, with the interquartile range in parentheses, over 6,484 distinct pairs of co-relevant documents; the ratio is the median of the 30 per-run ratios, so it differs slightly from the ratio of the two medians. Co-relevant documents share a cluster several times more often than chance, and the advantage grows with $K$, since finer clusters are more selective. But even with only ten clusters, more than half of the co-relevant pairs are split, and with fifty, more than three quarters are. A system that retrieves only the best-matching cluster will miss many relevant documents, a limit any cluster-based retrieval method has to work around.
What the test shows and does not show
The test also shows its limits. Nearly a third of the relevant documents had no relevant document among their five nearest neighbors, so similarity is a strong signal but far from a guarantee. Voorhees found that the strength of the effect varied across collections, and that collections where the hypothesis held well were not always ones where cluster-based retrieval beat document-based retrieval. A related property is used constantly without being called clustering. Pseudo-relevance feedback assumes that the top-ranked documents are relevant and retrieves more documents like them, which is the cluster hypothesis applied to a ranking.
The Cranfield tests are computed by tools/experiments/clustering/cluster_hypothesis.py and cluster_hypothesis_more.py in the site repository.
The rest of this topic
The K-means algorithm is the standard method for flat clustering. K-means in practice covers the decisions it leaves open, evaluating clusterings explains how to measure the result, and hierarchical clustering presents the main alternative.
References
- Cutting, D. R., Karger, D. R., Pedersen, J. O., and Tukey, J. W. (1992). Scatter/Gather: A cluster-based approach to browsing large document collections. In Proceedings of SIGIR 1992, 318–329.
- Hearst, M. A., and Pedersen, J. O. (1996). Reexamining the cluster hypothesis: Scatter/Gather on retrieval results. In Proceedings of SIGIR 1996, 76–84.
- Manning, C. D., Raghavan, P., and Schütze, H. (2008). Introduction to Information Retrieval, chapter 16 introduction and section 16.1. Cambridge University Press.
- van Rijsbergen, C. J. (1979). Information Retrieval, 2nd edition, chapter 3. Butterworths.
- Voorhees, E. M. (1985). The cluster hypothesis revisited. In Proceedings of SIGIR 1985, 188–196.