A collection holds 10,000 documents, of which 20 are relevant to a query. A system retrieves 40 documents, and 16 of them are relevant. How good is that? Two numbers describe it. Of the 40 documents retrieved, 16 are relevant, so precision is 0.4. Of the 20 relevant documents, 16 were found, so recall is 0.8. The system found most of what mattered but filled more than half its output with documents that do not. Whether that is good depends on the task, and that dependence is the main lesson of this article.
Precision and recall are defined for an unordered set of retrieved documents, the output of a Boolean system or the top portion of a ranking. They are the basis of every ranked measure in the following articles. This article follows Manning, Raghavan, and Schütze (2008, §8.3). The numbers in it are computed by tools/experiments/eval_measures/worked_examples.py and cranfield_measures.py in the site's repository and rounded to three decimals.
The contingency table
Every document in the collection falls into one of four cells, according to whether it was retrieved and whether it is relevant:
| Relevant | Nonrelevant | |
|---|---|---|
| Retrieved | true positives (TP) | false positives (FP) |
| Not retrieved | false negatives (FN) | true negatives (TN) |
For the example: TP = 16, FP = 24, FN = 4, and TN = 10,000 − 16 − 24 − 4 = 9,956. Filled in, the table reads:
| Relevant | Nonrelevant | Total | |
|---|---|---|---|
| Retrieved | 16 | 24 | 40 |
| Not retrieved | 4 | 9,956 | 9,960 |
| Total | 20 | 9,980 | 10,000 |
Precision is the fraction of retrieved documents that are relevant, computed along the top row:
$$P = \frac{TP}{TP + FP} = \frac{16}{40} = 0.4.$$
Recall is the fraction of relevant documents that are retrieved, computed down the left column:
$$R = \frac{TP}{TP + FN} = \frac{16}{20} = 0.8.$$
The two measures share a numerator and differ in the denominator. Precision divides by what the system chose to show; recall divides by what the collection contains. A system controls the first directly, by deciding how much to retrieve, but has no control over the second.
Each can be read as a conditional probability. Precision is $P(\text{relevant} \mid \text{retrieved})$, the chance that a retrieved document is relevant. Recall is $P(\text{retrieved} \mid \text{relevant})$, the chance that a relevant document is retrieved. Precision matters to a user scanning results, who pays for every nonrelevant document read. Recall matters to a user who must find everything, such as a lawyer, a patent examiner, or a systematic reviewer (see search in professional domains).
Recall has a practical difficulty that precision does not: it requires knowing every relevant document in the collection, including the ones the system missed. For a large collection that is rarely known exactly, which is why test collections estimate it from judged pools (see relevance judgments, pooling, and agreement).
Why not accuracy?
In classification, the usual measure is accuracy, the fraction of all decisions that are correct:
$$\text{accuracy} = \frac{TP + TN}{TP + FP + FN + TN}.$$
For the example system, accuracy is $(16 + 9{,}956)/10{,}000 = 0.9972$. That sounds excellent, until it is compared with a system that retrieves nothing at all. Retrieving nothing produces 20 false negatives and 9,980 true negatives, for an accuracy of 0.998, higher than the useful system's.
The problem is the skew of the collection. Nearly every document is nonrelevant to any given query, so the true negatives dominate the accuracy and almost any behavior scores near 1. Users never see the true negatives and do not care about them. Precision and recall ignore the TN cell entirely, focusing on the retrieved documents and the relevant ones, which is where retrieval quality lies (Manning, Raghavan, and Schütze, 2008, §8.3).
The trade-off
Precision and recall pull against each other. Recall never decreases as more documents are retrieved: retrieving the entire collection gives recall 1. Precision usually decreases, since each additional document is more likely to be nonrelevant once the best ones have been taken. Retrieving everything gives precision equal to the fraction of the collection that is relevant, here $20/10{,}000 = 0.002$. A system can raise either measure at the expense of the other, so neither one alone can say whether a system is better. A single number that combines them is needed.
The trade-off is easiest to see by taking a ranking and cutting it at every possible depth. Query 2 of the Cranfield collection asks what are the structural and aeroelastic problems associated with flight of high speed aircraft, and 24 of the collection's 1,400 documents are judged relevant to it. BM25 ranks the documents, and each cutoff $k$ defines a retrieved set of the top $k$:
| Documents retrieved $k$ | Relevant among them | Precision | Recall | $F_1$ |
|---|---|---|---|---|
| 9 | 5 | 0.556 | 0.208 | 0.303 |
| 10 | 5 | 0.500 | 0.208 | 0.294 |
| 50 | 8 | 0.160 | 0.333 | 0.216 |
| 200 | 12 | 0.060 | 0.500 | 0.107 |
| 1,400 | 24 | 0.017 | 1.000 | 0.034 |
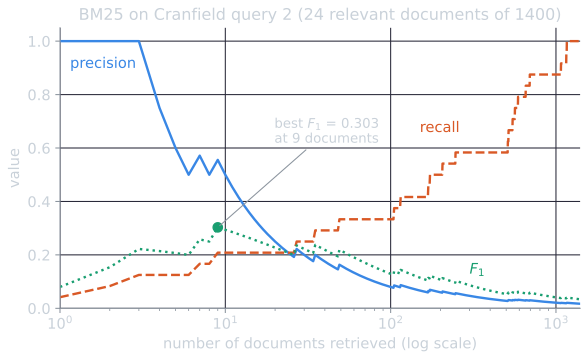
The first three results are relevant, so precision starts at 1. Then nonrelevant documents arrive faster than relevant ones and precision falls, with small upticks wherever a relevant document appears. Recall moves only when a relevant document is retrieved, so it is a staircase. Recall reaches 0.5 only when the twelfth relevant document arrives, at rank 173, by which point precision has fallen to 0.069. The last three relevant documents contain none of the query's terms after stemming, so BM25 gives them no score at all, and they are reached only after every scored document (783 of them) has been retrieved. No cutoff gives both high precision and high recall for this query; choosing a cutoff is choosing a point on the trade-off.
The F measure
The F measure combines precision and recall as a weighted harmonic mean. Its definition, and the two forms in which it usually appears, come out of a short derivation.
Derivation
The harmonic mean of two numbers is the reciprocal of the mean of their reciprocals. A weighted version gives precision weight $\alpha$ and recall weight $1 - \alpha$, with $0 \le \alpha \le 1$:
$$F = \frac{1}{\alpha \dfrac{1}{P} + (1 - \alpha) \dfrac{1}{R}}.$$
One way to see why reciprocals are averaged is that $1/P$ and $1/R$ are effort ratios. $1/P = (TP + FP)/TP$ is the number of documents retrieved per relevant document retrieved, and $1/R = (TP + FN)/TP$ is the number of relevant documents in the collection per relevant document found. Averaging these and inverting gives a measure that falls quickly when either ratio is large.
Multiplying the numerator and denominator by $PR$ clears the inner fractions:
$$F = \frac{PR}{\alpha R + (1 - \alpha) P}.$$
It is conventional to express the weighting by a single parameter $\beta$ that says how much more recall counts than precision, defined by $\beta^2 = (1 - \alpha)/\alpha$. Then $\alpha = 1/(\beta^2 + 1)$ and $1 - \alpha = \beta^2/(\beta^2 + 1)$. Substituting and multiplying the numerator and denominator by $\beta^2 + 1$:
$$F_\beta = \frac{PR}{\dfrac{R}{\beta^2 + 1} + \dfrac{\beta^2 P}{\beta^2 + 1}} = \frac{(\beta^2 + 1)\, P R}{\beta^2 P + R}, \qquad \beta^2 = \frac{1 - \alpha}{\alpha}.$$
With $\beta = 1$, equivalently $\alpha = 1/2$, the two count equally, giving the balanced F measure
$$F_1 = \frac{2 P R}{P + R}.$$
Values of $\beta < 1$ emphasize precision, and $\beta > 1$ emphasize recall. For the example system:
| Measure | Value |
|---|---|
| $F_1$ | $2(0.4)(0.8)/(0.4 + 0.8) = 0.533$ |
| $F_{0.5}$ (precision emphasized) | 0.444 |
| $F_2$ (recall emphasized) | 0.667 |
The system's strength is recall, so it scores higher when recall is emphasized.
F in terms of counts
Substituting $P = TP/(TP + FP)$ and $R = TP/(TP + FN)$ into $F_1$ and cancelling $TP$ gives a form that uses the contingency table directly:
$$F_1 = \frac{2\,TP}{2\,TP + FP + FN}, \qquad F_\beta = \frac{(1 + \beta^2)\, TP}{(1 + \beta^2)\, TP + \beta^2 FN + FP}.$$
For the example, $F_1 = 32/(32 + 24 + 4) = 32/60 = 0.533$, and $F_2 = 80/(80 + 16 + 24) = 0.667$. This form makes two things plain. The true negatives do not appear, so F inherits the indifference to TN that makes precision and recall suitable for retrieval. And $\beta^2$ is the price of a missed relevant document relative to a retrieved nonrelevant one: $F_2$ counts each false negative four times, $F_{0.5}$ counts it a quarter as much as a false positive.
What β means
Van Rijsbergen (1979, ch. 7) introduced the measure as an effectiveness $E = 1 - F$ and chose $\beta$ to express how many times as much the user values recall as precision. The derivatives make this precise. Differentiating $F_\beta$,
$$\frac{\partial F_\beta}{\partial P} = \frac{(1 + \beta^2) R^2}{(\beta^2 P + R)^2}, \qquad \frac{\partial F_\beta}{\partial R} = \frac{(1 + \beta^2) \beta^2 P^2}{(\beta^2 P + R)^2}.$$
The two are equal exactly when $R^2 = \beta^2 P^2$, that is, when $R/P = \beta$. On that line, a small gain in precision is worth the same as an equal gain in recall. Below it, where recall is less than $\beta$ times precision, improving recall raises $F_\beta$ more, and above it improving precision does. So $\beta$ is the ratio of recall to precision at which the user is indifferent between improving one or the other. (This is our derivation; checked numerically, at $P = 0.3$ the two derivatives agree at $R = 0.15$, $0.3$, and $0.6$ for $\beta = 0.5$, $1$, and $2$. Van Rijsbergen defines the user's relative importance as the ratio at which the two partial derivatives are equal, but the online text of his chapter writes that ratio as $P/R = \beta$; with $\alpha = 1/(\beta^2 + 1)$ the derivatives above are equal at $R/P = \beta$ instead.)
Why a harmonic mean
The arithmetic mean would be easy to game. Retrieving every document gives $P = 0.002$ and $R = 1$, whose arithmetic mean is 0.501. That is almost as good as a system with precision and recall both at 0.5, while being useless. The harmonic mean is dominated by the smaller of the two values: for the retrieve-everything system, $F_1 = 0.004$. A high harmonic mean requires both precision and recall to be reasonably high, which matches what makes a retrieved set useful. More generally, the harmonic mean is always at most the geometric mean, which is at most the arithmetic mean, with equality only when $P = R$. The harmonic mean penalizes imbalance most severely of the three (Manning, Raghavan, and Schütze, 2008, §8.3).
The three means for a few systems show the pattern:
| System | $P$ | $R$ | Arithmetic | Geometric | Harmonic ($F_1$) |
|---|---|---|---|---|---|
| The example | 0.400 | 0.800 | 0.600 | 0.566 | 0.533 |
| Balanced | 0.500 | 0.500 | 0.500 | 0.500 | 0.500 |
| Retrieve everything | 0.002 | 1.000 | 0.501 | 0.045 | 0.004 |
| One result, relevant, of 20 | 1.000 | 0.050 | 0.525 | 0.224 | 0.095 |
| Lopsided | 0.900 | 0.100 | 0.500 | 0.300 | 0.180 |
When $P$ and $R$ are close, the three means barely differ. When they are far apart, the arithmetic mean stays near the average of the two, while the harmonic mean stays near the smaller. The fourth row is the precision-side counterpart of retrieving everything: a system that returns a single relevant document has perfect precision and scores better than the balanced system on the arithmetic mean.
The difference is clearest as geometry. Every system is a point in the square of possible precision and recall values, and a measure assigns a value to each point. Its contours, the curves along which the measure is constant, show which systems it treats as equivalent.
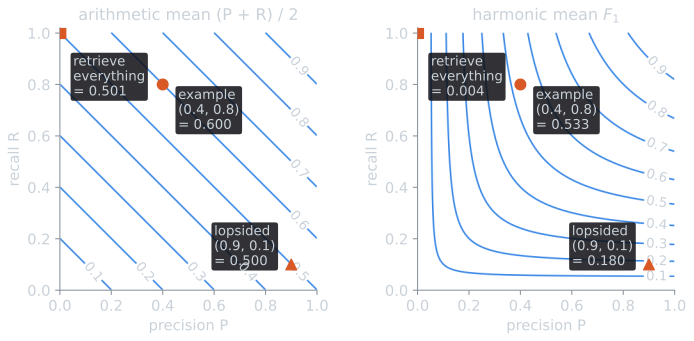
The arithmetic mean's contours are straight lines of slope −1: a unit of precision can always be traded for a unit of recall, wherever the system is. The F₁ contours bend. Solving $F_1 = c$ for recall gives $R = cP/(2P - c)$, a hyperbola with asymptotes $P = c/2$ and $R = c/2$. To reach $F_1 = 0.5$ a system needs recall of at least 1/3 even with perfect precision, and precision of at least 1/3 even with perfect recall. No amount of one compensates for too little of the other. Along the diagonal $P = R$, every mean equals the common value, which is why the contours of all three cross the diagonal at the same places.
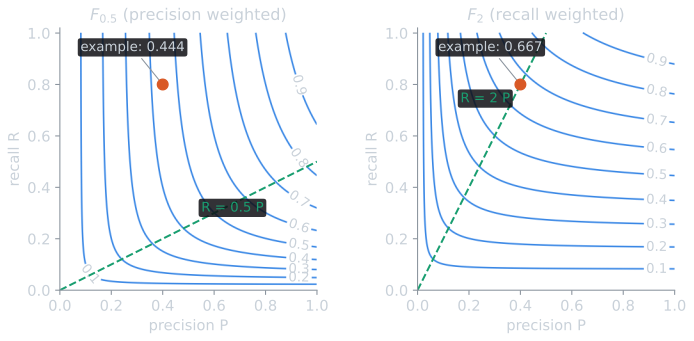
Weighting moves the asymptotes. Solving $F_\beta = c$ gives $R = c\beta^2 P / ((1 + \beta^2) P - c)$, a hyperbola with asymptotes $P = c/(1 + \beta^2)$ and $R = c\beta^2/(1 + \beta^2)$. For $F_2 = 0.5$ these are $P = 0.1$ and $R = 0.4$. Inside the square, the contour runs from $P = 1/6$ at perfect recall to $R = 4/9 \approx 0.444$ at perfect precision: a system can reach $F_2 = 0.5$ with poor precision, but not with poor recall. For $F_{0.5} = 0.5$ the roles swap. Each contour bends most sharply at its vertex, which lies exactly on the line $R = \beta P$ where the two derivatives are equal. (Writing the contour as $(P - a)(R - b) = ab$ with $a = c/(1 + \beta^2)$ and $b = c\beta^2/(1 + \beta^2)$, the vertex is at $P = a + \sqrt{ab}$, $R = b + \sqrt{ab}$, whose ratio is $\sqrt{b/a} = \beta$.)
Averaging over queries
Precision, recall, and F are computed for one query. A test collection has many, and there are two ways to combine them. A macro-average computes the measure for each query and takes the mean, so every query counts equally. A micro-average pools the contingency tables of all queries into one and computes the measure from the totals, so every document decision counts equally and queries with many relevant documents dominate (Manning, Raghavan, and Schütze, 2008, §13.6, describe the same distinction for text classification).
Suppose a second query retrieves 10 documents, 1 of them relevant, out of 2 relevant documents in the collection. With the example query:
| TP | FP | FN | $P$ | $R$ | $F_1$ | |
|---|---|---|---|---|---|---|
| Query A (the example) | 16 | 24 | 4 | 0.400 | 0.800 | 0.533 |
| Query B | 1 | 9 | 1 | 0.100 | 0.500 | 0.167 |
| Macro-average (mean of rows) | 0.250 | 0.650 | 0.350 | |||
| Micro-average (pooled counts) | 17 | 33 | 5 | 0.340 | 0.773 | 0.472 |
The micro-average is close to query A's values, because A contributes 16 of the 17 true positives. There is also a third number that is sometimes reported: $F_1$ computed from the macro-averaged precision and recall, $2(0.25)(0.65)/(0.25 + 0.65) = 0.361$, which is neither the mean $F_1$ (0.350) nor the micro $F_1$. Retrieval evaluation macro-averages by convention, because each information need is taken to matter equally, and mean average precision is a macro-average. A reported F should state which of these it is.
Common mistakes
- Treating precision and recall as symmetric. They are not interchangeable. Precision is under the system's control and can be measured from the retrieved documents alone; recall depends on documents nobody has looked at, and is only an estimate when judgments are incomplete.
- Reporting the F of averages as the average of Fs. As the table above shows, $F_1$ of the mean precision and mean recall differs from the mean $F_1$.
- Comparing F values with different β. $F_1 = 0.533$ and $F_2 = 0.667$ describe the same system. A higher number under a different weighting is not an improvement.
- Using F for a ranking. F needs a set, so applying it to a ranking needs a cutoff, and the choice of cutoff can matter more than the system. The measures in evaluating ranked results avoid the choice by looking at every cutoff at once.
From sets to rankings
Precision, recall, and F evaluate a set. Most systems return a ranking, and its quality depends on where the relevant documents appear, not only on whether they appear. The same quantities can be computed for the top $k$ results of a ranking, for each $k$, as in the Cranfield table above, which traces how precision and recall change as a user reads further down the list. That is the starting point of evaluating ranked results.
References
- Manning, C. D., Raghavan, P., and Schütze, H. (2008). Introduction to Information Retrieval, sections 8.3 and 13.6. Cambridge University Press.
- van Rijsbergen, C. J. (1979). Information Retrieval, 2nd edition, chapter 7. Butterworths.