The measures in this topic are short formulas, and implementing them looks trivial. Yet hand-written evaluation code is a common source of wrong results in retrieval experiments. It may divide average precision by the wrong count, or build the ideal ranking for nDCG from the wrong documents. It may break ties differently from the standard tools, or silently skip topics with no relevant documents. Each mistake changes the numbers, often in a direction that flatters the system being tested. This article gives a compact implementation of the main measures, as defined by Manning, Raghavan, and Schütze (2008, chapter 8), tested against the worked examples in the other articles of this topic, and describes the file formats and standard tools that make results comparable across research groups.
The TREC formats
Two plain-text formats, introduced by TREC, are the common currency of retrieval evaluation.
A qrels file holds the relevance judgments, one per line:
401 0 FBIS3-10082 1
401 0 FBIS3-10169 0
402 0 FT921-1123 2
The fields are the topic identifier, an unused iteration field (conventionally 0), the document identifier, and the relevance grade. Grades greater than zero count as relevant for binary measures.
A run file holds a system's rankings:
401 Q0 FBIS3-10082 1 14.73 mysystem
401 Q0 LA052390-0089 2 13.91 mysystem
The fields are the topic, the literal Q0, the document identifier, the rank, the score, and a name for the run. The standard tool, trec_eval, ignores the rank column and orders each topic's documents by score, breaking ties by document identifier in descending order, compared as strings (National Institute of Standards and Technology, trec_eval source, form_res_rels.c). Runs whose scores contain ties can therefore be evaluated in a different order from the one their author intended, and other tools may break ties differently. The implementation below breaks ties by ascending identifier, so it orders tied documents differently from trec_eval. The safe practice is to make scores strictly decreasing, so that no tie-break is needed. A later section shows how much the tie-break can matter.
An implementation
import math
from collections import defaultdict


def read_qrels(lines):
    """TREC qrels: 'topic iteration docno relevance' per line."""
    qrels = defaultdict(dict)
    for line in lines:
        topic, _, doc, rel = line.split()
        qrels[topic][doc] = int(rel)
    return qrels


def read_run(lines):
    """TREC run: 'topic Q0 docno rank score tag'. Ranked by score, ties by docno."""
    scored = defaultdict(list)
    for line in lines:
        topic, _, doc, _, score, _ = line.split()
        scored[topic].append((float(score), doc))
    return {t: [d for _, d in sorted(docs, key=lambda x: (-x[0], x[1]))]
            for t, docs in scored.items()}


def precision_at(ranking, judged, k):
    return sum(1 for d in ranking[:k] if judged.get(d, 0) > 0) / k


def recall_at(ranking, judged, k):
    relevant = sum(1 for g in judged.values() if g > 0)
    return sum(1 for d in ranking[:k] if judged.get(d, 0) > 0) / relevant if relevant else 0.0


def average_precision(ranking, judged):
    relevant = sum(1 for g in judged.values() if g > 0)
    if relevant == 0:
        return 0.0
    hits, total = 0, 0.0
    for k, d in enumerate(ranking, 1):
        if judged.get(d, 0) > 0:
            hits += 1
            total += hits / k
    return total / relevant          # divide by all relevant, not just those retrieved


def reciprocal_rank(ranking, judged):
    for k, d in enumerate(ranking, 1):
        if judged.get(d, 0) > 0:
            return 1 / k
    return 0.0


def ndcg_at(ranking, judged, k, exponential=False):
    gain = (lambda g: 2 ** g - 1) if exponential else (lambda g: g)
    dcg = sum(gain(judged.get(d, 0)) / math.log2(i + 1) for i, d in enumerate(ranking[:k], 1))
    ideal = sorted(judged.values(), reverse=True)[:k]
    idcg = sum(gain(g) / math.log2(i + 1) for i, g in enumerate(ideal, 1))
    return dcg / idcg if idcg > 0 else 0.0


def evaluate(qrels, run, k=10):
    per_topic = {}
    for topic, judged in qrels.items():
        ranking = run.get(topic, [])
        per_topic[topic] = {
            f"P@{k}": precision_at(ranking, judged, k),
            f"R@{k}": recall_at(ranking, judged, k),
            "AP": average_precision(ranking, judged),
            "RR": reciprocal_rank(ranking, judged),
            f"nDCG@{k}": ndcg_at(ranking, judged, k),
        }
    means = {m: sum(s[m] for s in per_topic.values()) / len(per_topic)
             for m in next(iter(per_topic.values()))}
    return per_topic, means
Several details in this code prevent the common mistakes:
- The topics come from the qrels, not the run. A topic the system returned nothing for still counts, with a score of zero. Iterating over the run's topics instead would silently drop failures and inflate the mean. By default, trec_eval averages only over topics that appear in both the run and the qrels; its
-coption includes the missing topics with scores of zero. - Average precision divides by every relevant document in the qrels, including those never retrieved, as explained in mean average precision.
- Unjudged documents count as nonrelevant, through
judged.get(d, 0). This is the standard convention, with the consequences discussed in relevance judgments, pooling, and agreement. - The ideal ranking for nDCG uses all judged documents for the topic, not only the retrieved ones, as explained in nDCG.
- Topics with no relevant documents score zero for recall, AP, and nDCG. Some tools skip them instead. Whichever convention is used should be stated, because it changes the mean.
Testing against the worked examples
The implementation reproduces the worked examples from the other articles. Encoding the two example queries from evaluating ranked results and mean average precision as qrels and run lines, with the never-retrieved relevant document of the first query included in its qrels, and evaluating at $k = 5$:
| Topic | P@5 | R@5 | AP | RR | nDCG@5 |
|---|---|---|---|---|---|
| 1 | 0.400 | 0.400 | 0.522 | 1.000 | 0.509 |
| 2 | 0.400 | 0.667 | 0.425 | 0.500 | 0.478 |
| Mean | 0.400 | 0.533 | 0.474 | 0.750 | 0.493 |
These match the hand calculations: AP 0.522 and 0.425, MAP 0.474, and MRR 0.75. On the graded example from nDCG, ndcg_at returns 0.961 with linear gain and 0.949 with exponential gain, again matching. Tests like these, built from small cases computed by hand, are the cheapest protection against evaluation bugs, and every measure should have one. The code above is kept, character for character, in tools/experiments/eval_measures/measures.py in the site's repository, and worked_examples.py there checks both that the article's code block matches the file and that the file reproduces every number in this topic's measure articles.
Where implementations disagree
Two correct implementations of the same measure can still return different numbers, because the definitions leave some decisions open. The cases below are small enough to check by hand, and each shows a real difference between the code above, the textbook definitions, and trec_eval. The trec_eval behavior is read from its source code (National Institute of Standards and Technology, trec_eval, the files named below).
Ties in the scores
A topic has three relevant documents, 12, 10 and 7. A run scores document 12 at 3.0, documents 10, 7, 8 and 9 all at 2.0, and document 11 at 1.0, and its rank column lists the tied documents in the order 10, 7, 8, 9. Each tool sorts by score and then resolves the tie its own way:
| Tie-break | Order of the tied documents | AP | P@3 |
|---|---|---|---|
| The rank column, as the author intended | 10, 7, 8, 9 | 1.000 | 1.000 |
| trec_eval: identifier descending, as strings | 9, 8, 7, 10 | 0.700 | 0.333 |
| The code above: identifier ascending, as strings | 10, 7, 8, 9 | 1.000 | 1.000 |
| Identifier ascending, as numbers | 7, 8, 9, 10 | 0.867 | 0.667 |
Over all 24 orderings of the tied block, AP ranges from 0.700 to 1.000. String comparison adds a further surprise: as strings, 9 comes after 10, so trec_eval puts 9 first among the tied documents and 10 last.
On a real collection the effect depends on how often a model produces ties. The Binary Independence Model without relevance information scores a document by summing a weight for each query term it contains, so all documents containing the same query terms tie. On Cranfield, 121 of the 225 queries have a tie within the BIM's top ten. BM25 and TF-IDF use term frequencies and document lengths, which almost never coincide exactly.
| Model | MAP, ties by ascending number (as in comparing ranking models) | MAP, ties by ascending string (the code above) | MAP, trec_eval's tie-break | Queries whose AP differs between the first and third |
|---|---|---|---|---|
| BIM | 0.2204 | 0.2184 | 0.2182 | 179 |
| TF-IDF | 0.2942 | 0.2942 | 0.2942 | 0 |
| BM25 | 0.3066 | 0.3066 | 0.3065 | 8 |
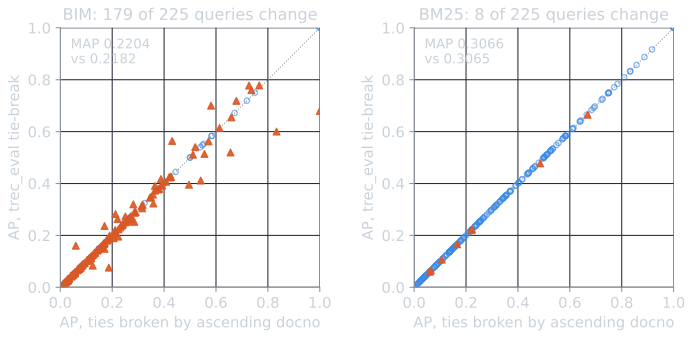
The means barely move, because the per-query changes go both ways and largely cancel. But individual queries change by up to 0.321, and a significance test, which works on the per-query values, sees those changes in full. A run with heavy ties should either break them deliberately, for example by adding a tiny decreasing amount to the scores in the intended order, or be reported with the tie-break stated.
Interpolated precision at recall levels
The textbook definition takes interpolated precision at recall level $r$ as the maximum precision at any recall of at least $r$. trec_eval's iprec_at_recall instead turns each level into a number of relevant documents, rounding $r \times R$ to the nearest integer, and takes the maximum precision from the rank of that relevant document onward (m_iprec_at_recall.c). When $R = 5$, as in the first worked query, the two agree at all eleven levels, since every level times 5 rounds to the right count. When $R = 3$ they need not. For the second worked query, with relevant documents at ranks 2, 5 and 8:
| Recall level | 0.0 to 0.3 | 0.4 | 0.5 | 0.6 | 0.7 | 0.8 | 0.9 | 1.0 | 11-point mean |
|---|---|---|---|---|---|---|---|---|---|
| Textbook | 0.500 | 0.400 | 0.400 | 0.400 | 0.375 | 0.375 | 0.375 | 0.375 | 0.427 |
| trec_eval | 0.500 | 0.500 | 0.400 | 0.400 | 0.400 | 0.400 | 0.375 | 0.375 | 0.441 |
At level 0.4, the textbook needs recall of at least 0.4, which the query first reaches with its second relevant document (recall 0.667, at rank 5, precision 0.4). trec_eval rounds $0.4 \times 3 = 1.2$ to 1 and starts from the first relevant document (rank 2, precision 0.5). At 0.7 and 0.8 the same rounding, $2.1$ and $2.4$ to 2, uses the second relevant document instead of the third. The difference is small and systematic: trec_eval's curve is never below the textbook's.
Unjudged documents
The code above, like trec_eval by default, counts an unjudged document as nonrelevant. trec_eval's -J option instead removes unjudged documents from the ranking before computing anything, and its documentation warns against using it without care. Suppose the documents at ranks 2 and 4 of the first worked query had never been judged:
| Treatment of the unjudged documents | AP | P@5 |
|---|---|---|
| As nonrelevant (default) | 0.522 | 0.400 |
Removed from the ranking (-J) |
0.664 | 0.600 |
Removing them closes the gaps, so the relevant documents at ranks 3, 6 and 9 move up to 2, 4 and 7. Neither number is the true value, which depends on whether the two documents are relevant. The first treats ignorance as failure, the second as if the documents did not exist. Measures designed for this situation are described in relevance judgments, pooling, and agreement.
Topics missing from the run
If the qrels have three topics and the run has rankings for only the two worked queries, trec_eval by default averages over the two, giving MAP $(0.522 + 0.425)/2 = 0.474$. With -c it averages over all three, scoring the missing topic 0, and MAP is $0.947/3 = 0.316$. The code above always does the latter, because it iterates over the qrels. A system that crashes on a third of the topics should not be able to keep its score by producing no output for them.
GMAP and zero scores
The geometric mean is undefined when a topic has AP of zero. trec_eval's gm_map replaces each AP by the larger of it and 0.00001 before taking logarithms (m_gm_map.c), while other tools add a small constant to every value. The MAP article explains why the floor matters.
A checklist of conventions
| Decision | The code above | trec_eval default |
|---|---|---|
| Order of documents | by score, ties by identifier ascending | by score, ties by identifier descending (as strings) |
| Topics averaged | all topics in the qrels | topics in both qrels and run (-c for all) |
| Unjudged documents | nonrelevant | nonrelevant (-J removes them) |
| Relevant | grade greater than 0 | grade at least 1 (-l changes the threshold) |
| AP denominator | all relevant documents in the qrels | the same |
| nDCG gain and discount | grade, $1/\log_2(i + 1)$ | grade (configurable), $1/\log_2(i + 1)$ |
| nDCG ideal ranking | all judged documents | the same |
| Ranking depth | everything in the run | everything in the run (-M limits it) |
Standard tools
For published results, standard tools are preferable to custom code, because reviewers and other researchers can reproduce the numbers exactly.
- trec_eval, maintained by NIST, is the reference implementation used in TREC. It reads qrels and run files and reports dozens of measures, per topic or averaged.
- pytrec_eval gives Python programs direct access to trec_eval's implementation, without writing files or calling an external program (Van Gysel and de Rijke, 2018).
- ir_measures provides one interface to measures from several implementations, with measures named precisely, for example
nDCG@10orP(rel=2)@5, so that the exact variant used is recorded with the result (MacAvaney, Macdonald, and Ounis, 2022).
Even with standard tools, the measure variant, the cutoff, the treatment of unjudged documents and of topics with no relevant documents, and the version of the qrels should all be reported. Two papers can both report "nDCG@10" for the same collection and mean different things.
Putting it together
A complete offline evaluation follows these steps:
- Run each system on the test topics and write a run file.
- Compute per-topic measures for each run against the qrels.
- Report the means, the cutoffs, and the measure variants.
- Compare systems with a paired significance test over the per-topic scores.
- Check how many top-ranked documents were unjudged.
The per-topic scores from step 2 are the input to the significance tests, which is one reason evaluation code should always produce them, not only the means.
References
- MacAvaney, S., Macdonald, C., and Ounis, I. (2022). Streamlining evaluation with ir-measures. In Proceedings of ECIR 2022, 305–310.
- Manning, C. D., Raghavan, P., and Schütze, H. (2008). Introduction to Information Retrieval, chapter 8. Cambridge University Press.
- National Institute of Standards and Technology. trec_eval. https://github.com/usnistgov/trec_eval
- Van Gysel, C., and de Rijke, M. (2018). Pytrec_eval: An extremely fast Python interface to trec_eval. In Proceedings of SIGIR 2018, 873–876.